This website respects your privacy. It does not use cookies at all, nor does it uniquely identify who you are, nor does it sell any information about you. This website furthermore does not offer any products or services for sale.
Measuring Amsterdam food price inflation over 11 years with my own data
- Sept 2024
While visiting Amsterdam in 2013, I kept receipts for foods that I bought, and I recorded the prices of a couple items that I didn't buy. I was mainly shopping at an Albert Heijn supermarket.
Today, that chain makes their prices available online, so a rough comparison is possible between 2013 prices and 2024 prices.
While many food items' prices have increased a lot, not all are quite as bad as you might expect. That said, it is known that 2022-2023 did see a large general inflation spike in the Netherlands, up to 18%.
Yet between 2013 and 2024, there were also many months when inflation fell to zero and a few months when it went negative.
Annual CPI increases in the Netherlands:
- 2013 2.5%
- 2014 1.0%
- 2015 0.6%
- 2016 0.3%
- 2017 1.4%
- 2018 1.7%
- 2019 2.6%
- 2020 1.3%
- 2021 2.7%
- 2022 10.0%
- 2023 3.8%
- 2024 forecast 2.9%
- Cumulative: 1.35X or 35%.
That's CPI, so food is just one component.
My data, which consists of prices for a very limited selection of foods that excluded dairy, meat and bread, is an increase in food prices of 55% over 11 years.
Measuring USA food price inflation over 2 years with my own data
- Aug 2024
I recently discovered that I have receipts from food delivery orders that I made back in 2022.
It was trivial to bring up the current prices for the same items, so what does one see when comparing 2022 prices to current August 2024 prices?
From my set of products that I bought between June 1st and August 1st 2022, the average food inflation between then and August 2024 is 14%.
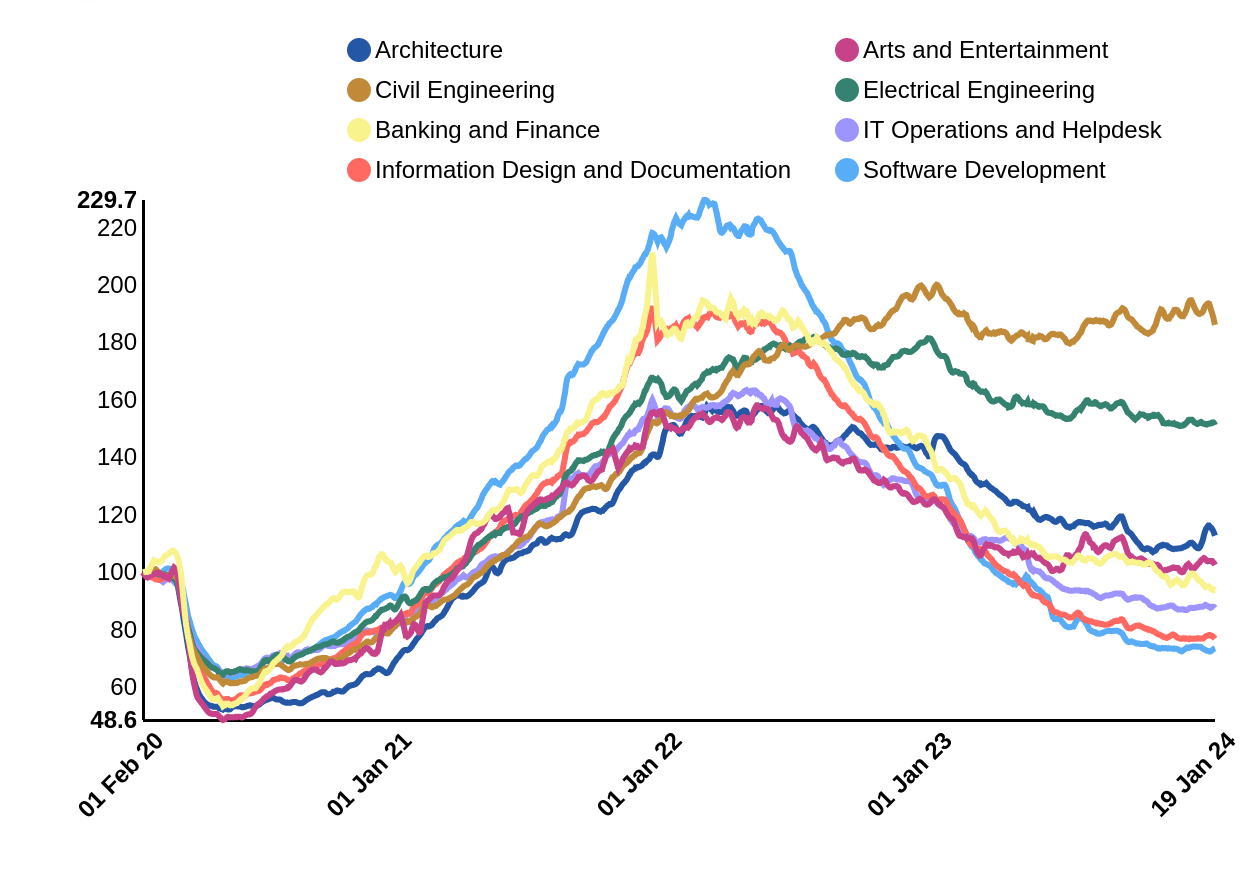
Most white-collar job ads decreased on Indeed over the past 2 years
- Jan 2024
Source: Indeed
Biden regime pushes for disastrous privatization of public water supplies
- Sept 2023
In general, privatized water leads to increased prices and decreased quality. Biden's expert on the matter is a Goldman Sachs director.
Electricity prices per kilowatt hour in the US in 2021
- Jul 2022
It was most expensive here:
| State | Cents per kilowatt/hour |
|---|---|
| Hawaii | 30.31 |
| Alaska | 20.02 |
| California | 19.65 |
| Massachusetts | 19.06 |
| Rhode Island | 18.44 |
| Connecticut | 18.32 |
| Vermont | 16.34 |
| New York | 16.11 |
| State | Cents per kilowatt/hour |
| Idaho | 8.17 |
| Wyoming | 8.25 |
| Utah | 8.34 |
| Oklahoma | 8.52 |
| Nevada | 8.58 |
| North Dakota | 8.65 |
| Washington | 8.75 |
| Louisiana | 8.82 |
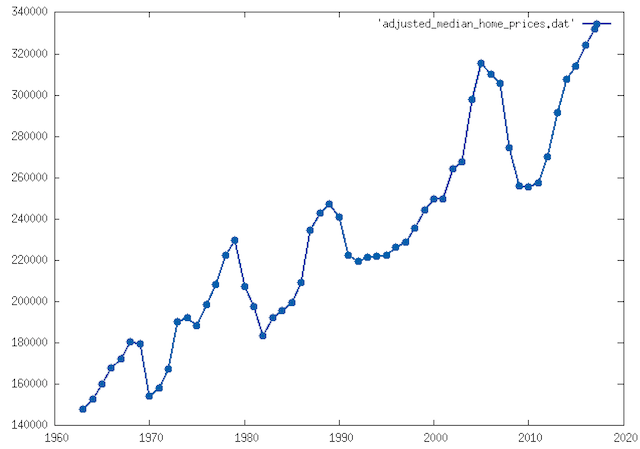
Median Home Price of New Homes Sold in United States 1963-2017
- Jul 2020
Here's a quick graph showing the median home prices for the entire USA for the last 55 years, based on this data source. It is adjusted for inflation using the CPI inflation calculator.
Click here for the same graph, not adjusted for inflation
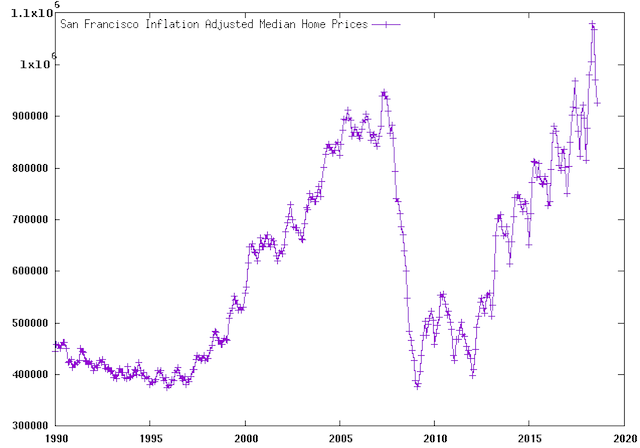
Median Prices of Homes in San Francisco 1990-2018
- Jul 2020
This graph is adjusted for inflation.
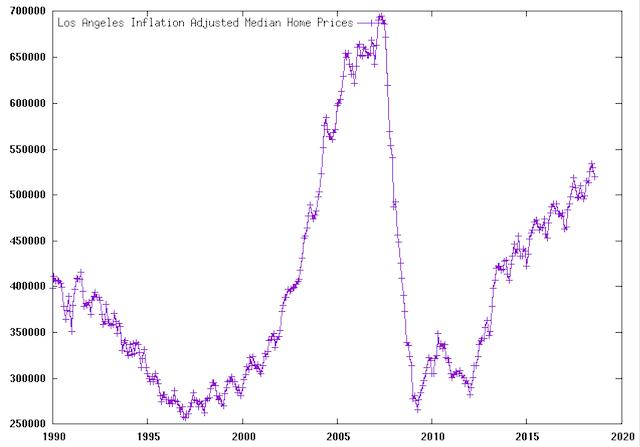
Median Prices of Homes in Los Angeles 1990-2018
- Jul 2020
This graph is adjusted for inflation.


